树莓派OpenCV系列教程5:ROI,绘图一站式解析
本章接上一章之后,来介绍图像处理中的其它一些操作,主要包括ROI和绘图,这些操作在实际处理中也经常用到。
1 ROI
ROI(Region Of Interest)是指需要处理的那一部分图像,本节将通过一个示例讲解通过鼠标选中图形ROI区域。
1.1 Python3
在Python中,主要涉及到selectROI函数,其函数原型如下:
<syntaxhighlight lang="python">
rect = cv2.selectROI("image", img, showCrosshair, fromCenter)
</syntaxhighlight>
True:显示网格
False:只有矩形
- fromCenter:
True:第一次选中的点为矩形的中心.
False:第一次选中的点为矩形的左上角.
返回的是一个tuple值, 代表矩形区域. 分别代表矩形左上角坐标 (x, y) 与矩形宽度w跟高度h
(x, y, w, h) = rect
使用numpy切片功能的时候要注意, 第一维指的是行数, 第二维度指的是列数.
imCrop = img[y : y+h, x:x+w]
接下来,直接上源码:
<syntaxhighlight lang="python">
import numpy as np
import cv2

img = cv2.imread('color.jpg')

# create a window
cv2.namedWindow('image', flags= cv2.WINDOW_NORMAL | cv2.WINDOW_FREERATIO)
cv2.namedWindow('image_roi', flags= cv2.WINDOW_NORMAL | cv2.WINDOW_FREERATIO)

cv2.imshow('image', img)

# whether to show crosschair
showCrosshair = True
# if true, then from the center
# if false, then from the left-top
fromCenter = False
# then let use to choose the ROI
rect = cv2.selectROI('image', img, showCrosshair, fromCenter)

# get the ROI
(x, y, w, h) = rect

# Crop image
imCrop = img[y : y+h, x:x+w]

# Display cropped image
cv2.imshow('image_roi', imCrop)

# write image to local disk
cv2.imwrite('image_roi.png', imCrop)
cv2.waitKey(0)
</syntaxhighlight>
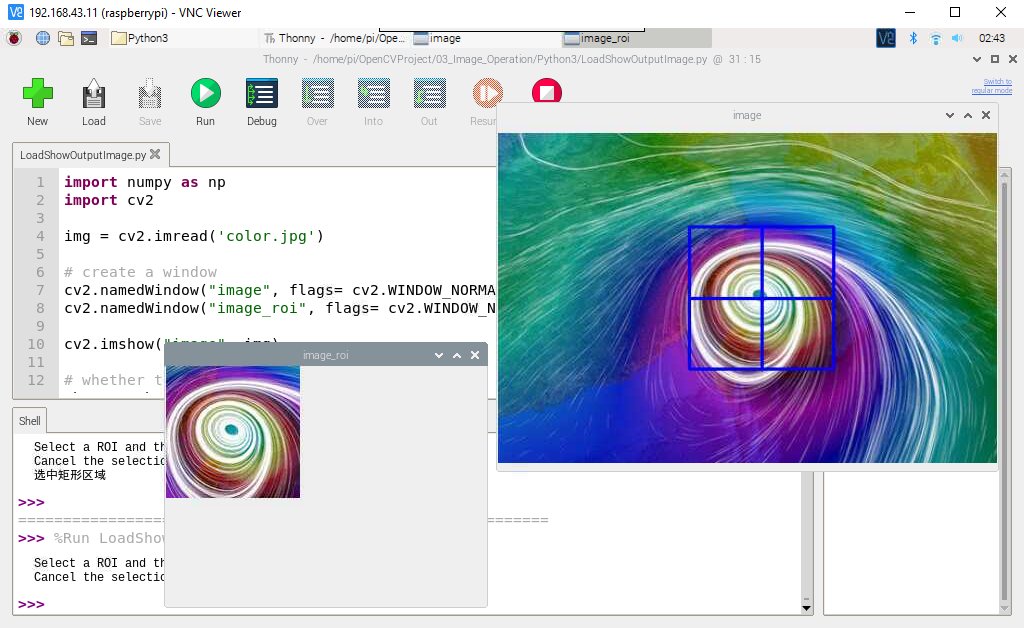
运行程序后,按住鼠标左键选中ROI,按下Enter键裁剪得到需要的ROI区域,并显示到另一个窗口中,如果需要取消ROI区域选择,请按下C键。
1.2 C++
<syntaxhighlight lang="python">
#include<iostream>
#include<opencv2/opencv.hpp>
#include<opencv2/highgui/highgui.hpp>
#include<opencv2/imgproc/imgproc.hpp>

using namespace std;
using namespace cv;

int main()
{
    Mat img,imCrop;
    Rect rect;

    img = imread("color.jpg");

    // create a window
    namedWindow("image", WINDOW_NORMAL | WINDOW_FREERATIO);
    namedWindow("image_roi", WINDOW_NORMAL | WINDOW_FREERATIO);

    imshow("image",img);

    // whether to show crosschair
    bool showCrosshair = true;
    // if true, then from the center
    // if false, then from the left-top
    bool fromCenter = false;
    // then let use to choose the ROI
    rect = selectROI("image", img, showCrosshair, fromCenter);

    // get the ROI and crop the image
    imCrop = img(rect);

    // Display cropped image
    imshow("image_roi",imCrop);

    // write image to local disk
    imwrite("image_roi.jpg", imCrop);
    waitKey(0);
    return 0;
}
</syntaxhighlight>
其C++源码运行效果同Python源码。
2 绘图
接下来将讲解OpenCV中绘图的使用,在计算机视觉领域,使用绘图功能是一个非常高频的需求,例如,在颜色识别,人脸识别,物体识别中,识别到具体的物体,可以将其打印出来,也可以直接在原图中绘制一个圆形等,显而易见,后者效果更好。
注意,OpenCV可以绘制的图形,其实matplotlib也都可以,OpenCV之所以还提供一个绘图功能是因为OpenCV绘图是直接在原图上进行绘图的,并且使用的是默认的BGR色彩空间,所以,OpenCV默认的绘图功能会更加方便一些。
2.1 Python3
接下来首先介绍在OpenCV中常见的几何图形绘制与文本绘制,例如,直线,矩形,圆形,多边形,椭圆等。
- 初始化画布
在Python中,图像数据是通过numpy的ndarray存储的,首先,应当初始化一个ndarra数据结构用于存储图像:
具体处理如下所示:
<syntaxhighlight lang="python">
def InitPaint(width, height, color=(255, 255, 255)):
    paint = np.ones((height, width, 3), dtype="uint8")
    paint[:] = color
    return paint
</syntaxhighlight>
- 绘制直线
函数的函数原型:
<syntaxhighlight lang="python">
cv2.line(img=canvas, pt1=(300, 0), pt2=(0, 300), color=COLOR_MAP["red"], thickness=3)
</syntaxhighlight>
- 绘制矩形
函数原型:
<syntaxhighlight lang="python">
cv2.rectangle(img=canvas, pt1=(50, 200), pt2=(200, 225), color=COLOR_MAP["green"], thickness=5)
</syntaxhighlight>
- 绘制圆形
函数原型
<syntaxhighlight lang="python">
cv2.circle(img=canvas, center=(150, 150), radius=60, color=(0, 0, 255), thickness=5)
</syntaxhighlight>
- 绘制多边形
函数原型
<syntaxhighlight lang="python">
cv2.polylines(img=canvas, pts=[points], isClosed=True, color=(0,0,255), thickness=3)
</syntaxhighlight>
- 绘制椭圆
函数原型
<syntaxhighlight lang="python">
cv2.ellipse(img=canvas,center=(256,256), axes=(100,50), angle=0, startAngle=0, endAngle=360, color=(100, 200, 0), thickness=-1)
</syntaxhighlight>
- 绘制文字
函数原型
<syntaxhighlight lang="python">
font = cv2.FONT_HERSHEY_SIMPLEX
cv2.putText(canvas, text="HelloWorld", org=(50, 200), fontFace=font, fontScale=2, thickness=1, lineType=cv2.LINE_AA, color=(0, 0, 255))
</syntaxhighlight>
- 样例演示
<syntaxhighlight lang="python">
import cv2
import numpy as np

COLOR_MAP = {
    "blue": (255, 0, 0),
    "green": (0, 255, 0),
    "red": (0, 0, 255),
    "white": (255, 255, 255)
}

def InitPaint(width, height, color=COLOR_MAP["white"]):
    paint = np.ones((height, width, 3), dtype="uint8")
    paint[:] = color
    return paint

paint = InitPaint(300, 300)

cv2.line(paint, pt1=(0, 0), pt2=(300, 300), color=COLOR_MAP["green"])

cv2.circle(paint, center=(150, 150), radius=50, color=COLOR_MAP["green"])

cv2.circle(paint, (150, 150), 30, color=COLOR_MAP["blue"], thickness=-1)

cv2.rectangle(paint, (10, 10), (60, 60), COLOR_MAP['red'])

points = np.array([[100,50],[200,200],[270,200],[290,100]], np.int32)

points = points.reshape((-1,1,2))

cv2.polylines(paint, pts=[points], isClosed=True, color=COLOR_MAP["red"], thickness=3)

cv2.ellipse(img=paint,center=(256,256), axes=(40,20), angle=0, startAngle=0, endAngle=360, color=(100, 200, 0), thickness=-1)

font = cv2.FONT_HERSHEY_SIMPLEX

line = cv2.LINE_AA

cv2.putText(img=paint, text="Hello", org=(10, 250), fontFace=font, fontScale=2, color=(0, 0, 255),thickness=1, lineType=line)

cv2.imshow('Paint', paint)

cv2.waitKey(0)
</syntaxhighlight>
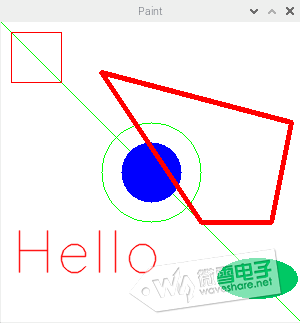
该程序运行后,将显示如下所示图像:
2.2 C++
其C++源码类似如下:
<syntaxhighlight lang="python">
#include<iostream>
#include<opencv2/opencv.hpp>
#include<opencv2/highgui/highgui.hpp>
#include<opencv2/imgproc/imgproc.hpp>

using namespace std;
using namespace cv;

Mat InitPaint(int width, int height, Scalar color)
{
    Mat paint = Mat(width, height,CV_8UC3,color);
    return paint;
}

int main()
{
    Mat paint = InitPaint(300,300,Scalar(255,255,255));

    line(paint, Point(0, 0), Point(300, 300), Scalar(0,255,0));

    circle(paint, Point(150, 150), 50, Scalar(0,255,0));

    circle(paint, Point(150, 150), 30, Scalar(255,0,0), -1);

    rectangle(paint, Point(10, 10), Point(60, 60),Scalar(0,0,255));

    Point points[1][4];

    points[0][0] = Point(100,50);
    points[0][1] = Point(200,200);
    points[0][2] = Point(270,200);
    points[0][3] = Point(290,100);

    const Point* pts[] = {points[0]};
    int npt[] = {4};

    polylines(paint, pts, npt,1,true, Scalar(0,0,255), 3);

    ellipse(paint,Point(256,256), Size(40,20), 0, 0, 360, Scalar(100, 200, 0), -1);

    int font = FONT_HERSHEY_SIMPLEX;

    int line = LINE_AA;

    putText(paint, "Hello", Point(10, 250), font, 2.0, Scalar(0, 0, 255), 1,line);

    imshow("Paint", paint);

    waitKey(0);

    return 0;
}
</syntaxhighlight>
其C++源码运行效果同Python源码。

